To prepare for business growth, you want to track your KPIs (key performance indicators). You use KPI dashboards that show how your campaigns are performing against goals for revenue, growth, retention, and metrics. To succeed here, what you need is to focus on ongoing strategies that engrain analytics in all your processes and decisions.
Read on to see what advice Broadly offers for implementing and managing KPI metrics in your workflows and how to use KPI dashboards properly.
Table of Contents
What Are KPIs?
A key performance indicator, or KPI, measures how business goals and objectives are being met by your business strategies. You set measurable targets for retention, acquisition, revenue, and other growth indicators. Your teams set specific KPI measures focused on their departments that support the company’s overall objectives.
What’s a KPI Dashboard?
You want to build solid KPI dashboards with apt data teams, giving them access to advanced business intelligence platforms. On the front end, the design has to be functional and friendly for the business user who isn’t a data analyst.
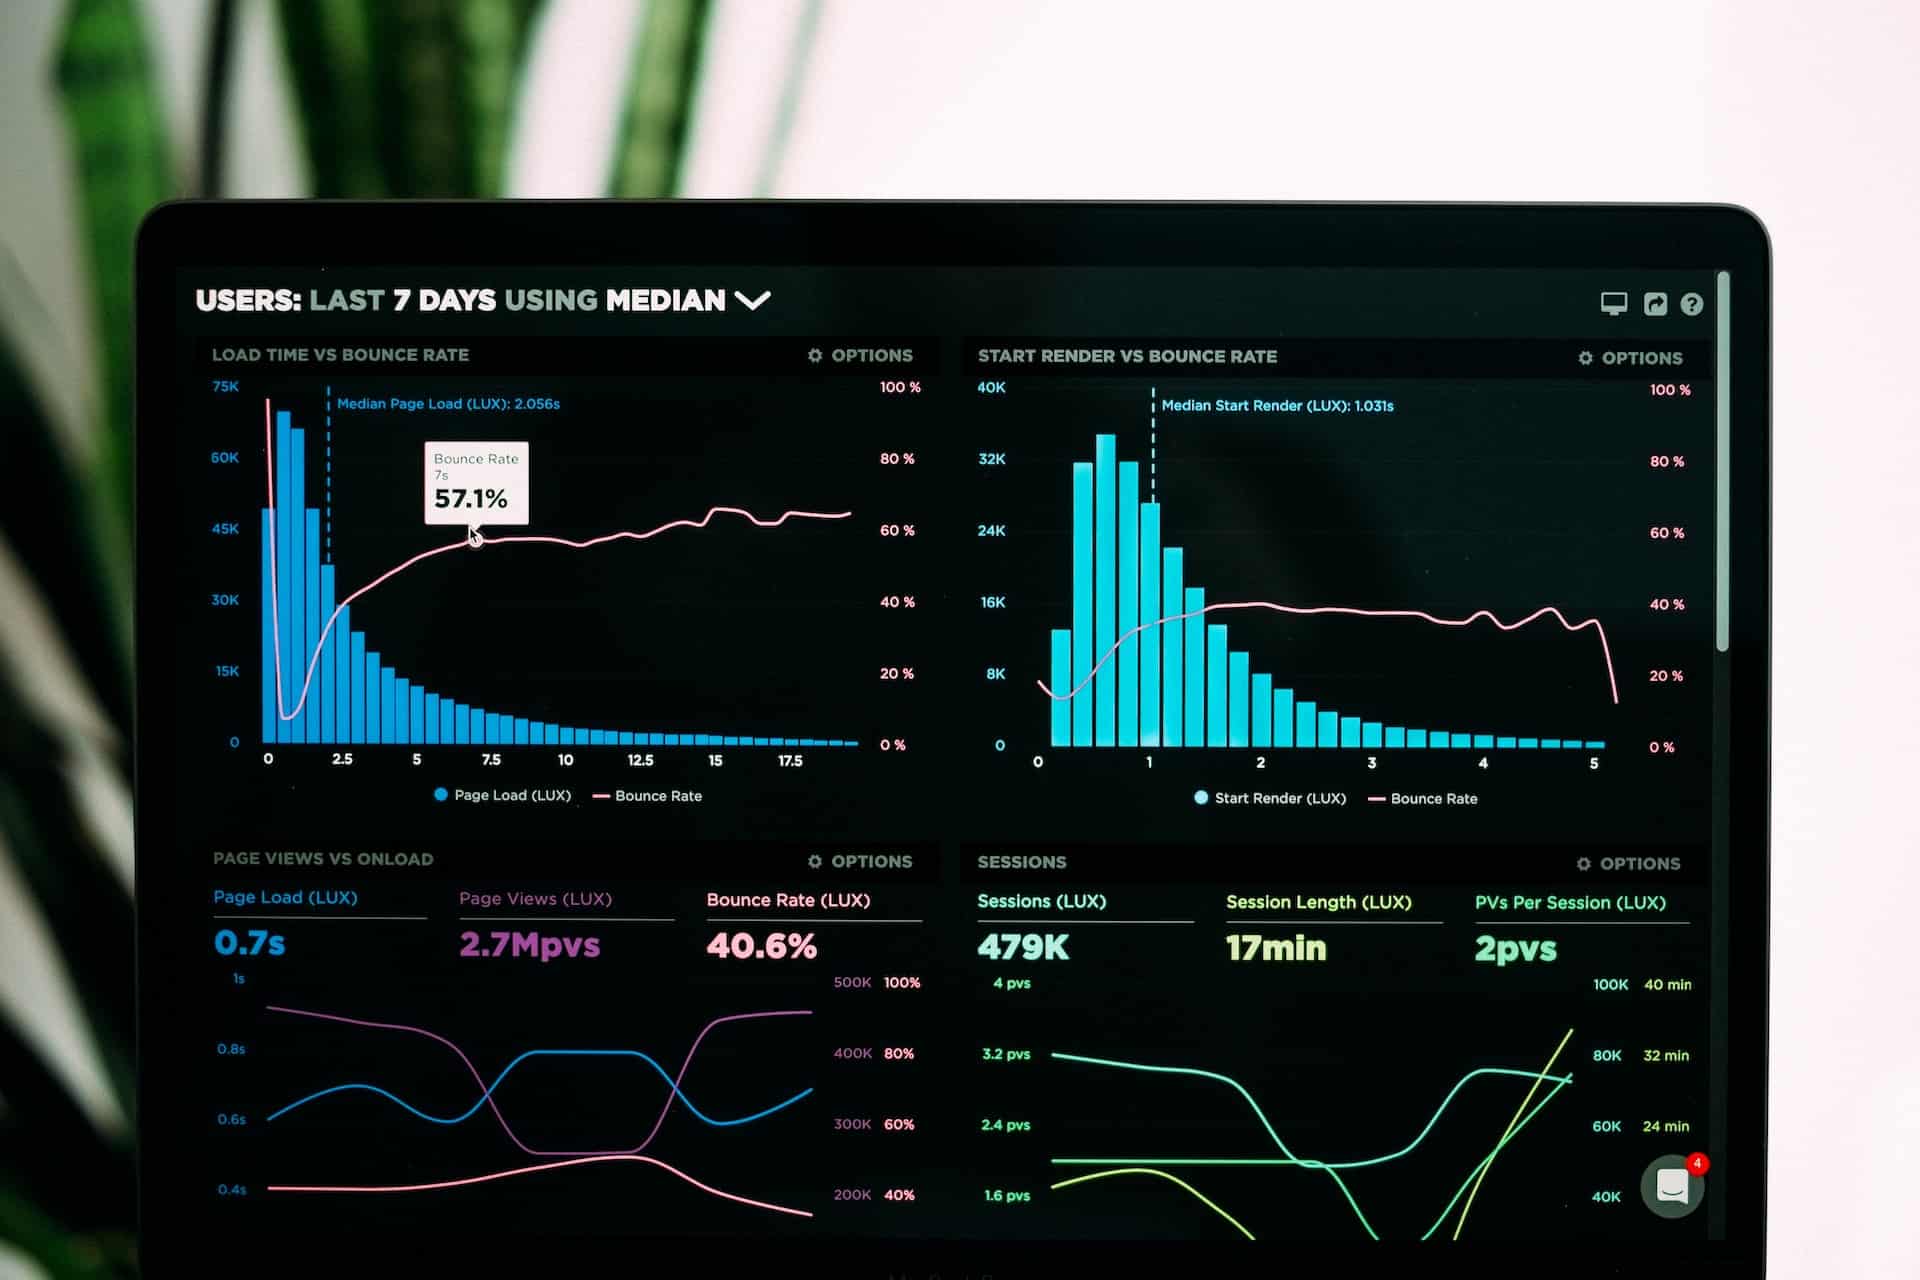
With a dashboard, data gets compiled from sources like the company website, accounting systems, apps, marketing tools, etc. With an ETL resource, data is stored in an enterprise data warehouse. Considered the core of business intelligence, the warehouse creates analytical studies for your teams using the data.
A successful KPI dashboard establishes the bar for goals and drives the company in its objectives. It can centralize data from dozens and even hundreds of sources. It normalizes and translates data, revealing how the company’s performing. Stakeholders, marketers, accounting, HR; everyone has what they need to improve operations.
KPI Reporting
Reporting on KPIs has, in one form or another, always been deeply ingrained in marketing. But long gone are the days of static reports produced weekly, monthly, quarterly, or ad hoc for management and stakeholders. Using modernized dashboards, everyone from plumbers to Fortune 50 CEOs can access collaborative, dynamic materials that put everyone on the same page.
Considerations for KPI Dashboards
To put together your dashboard, you need a workflow that processes and visualizes huge amounts of data in as close to real-time as possible. Keeping the following information in mind will help accomplish that.
Select an ETL Tool
ETLs pipe data from various sources into one warehouse, extracting and transforming (i.e., normalizing the data using top practices and your team’s guardrails) before storing data in your warehouse.
Build Your Dashboards and Reports
After ETLs have cleaned your data and made it accessible, your team can work on prioritizing it. That usually entails creating a dashboard for individual departments. Dashboard users scan for specific metrics and see underlying data related to them, allowing users to find and export what they need for reports and presentations.
Decide on Internal Data Products
KPI tracking can go beyond allowing teams to see the info and build reports. Teams can develop customized self-serve products that let users access versatile reporting that doesn’t require education in analytics. They can build without SQL experience. Yes, the learning curve may take time and care for users to become adept, but the ROI will be invaluable.
KPI Security
Not surprisingly, your dashboard will contain massive amounts of confidential information. You want to share this data safely, using permissions to ensure the appropriate individuals in the organization access only the data they need. Dashboards are set up so that individuals and groups only access what they need to move forward. Better yet, access can be broken into subcategories within departments as needed.
Collections: Typically housing an entire department’s analytics, only those team members can review this data.
Groups: With specific editor and viewer permissions, Groups give a range of team members access to specific (or all) data.
Connections: These permissions limit a user’s ability to view and query data.
Know Your Targets: Socializing KPI Dashboards
From the first stages of initiation, your KPI dashboard build has to be considered a critical component of your data-driven culture, affecting every executive and team member in the organization. Even the most naïve stakeholder with no tech experience should be a part of your KPI development to ensure no parties get left out of creating the system you need.
Conclusion
To manage KPIs, you want a well-versed system for tracking performance in an easy and sophisticated manner. Whether you want to market a global tech company or a plumbing business, KPI dashboards promote smooth collaboration and encourages engagement at all levels of management.